X

Customize this with your settings this pictograph template, symbolizing balanced comparison or 50/50 distribution between two datasets.
Two Item Matrix Comparison Pictograph
Presentation Clipart
Customize this ten-item row pictograph with your settings to visualize fractions and proportions, making complex data easy to understand.
Ten Item Row Pictograph Template
Presentation Clipart
Customize this ten item row pictograph with your own settings for a visual display of quantities using uniform icons for clarity.
One Row Data Comparison Pictograph Template
Presentation Clipart
Customize Three-Category Data Pictograph with your settings this to visually represent data distribution across three categories.
Three Category Data Pictograph Template
Presentation Clipart
Customize this 'four row comparison' pictograph  with your settings to visualize data distribution across four categories in one image.
Four Row Comparison Pictograph Template
Presentation Clipart
Customize this  three-item matrix pictograph with your settings to easily compare and analyze data across three categories.
Three Item Matrix Comparison Pictograph
Presentation Clipart
Customize this four-item matrix pictograph with your settings  for clear data visualization and easy comparison across four categories.
Four Item Matrix Comparison Pictograph Template
Presentation Clipart
Download this productivity pictograph template symbolizing time management with an hourglass and balanced icons, emphasizing efficiency.
Productivity Pictograph Template
Presentation Clipart
A widescreen presentation slide from radar-chart-interactive-pid-30527 preview one.
A widescreen presentation slide from Interactive Radar Chart PowerPoint Diagram preview two.
A widescreen presentation slide from Interactive Radar Chart PowerPoint Diagram preview three.
Interactive Radar Chart PowerPoint Diagram
Download or customize with your settings this pictograph showing poverty levels across U.S. states. Larger circles reflect higher poverty percentages.
Poverty Line Pictograph Template
Presentation Clipart
Download or customize this freshwater usage pictograph, showcasing consumption percentages for agriculture, industry, and domestic use.
Freshwater Usage Pictograph Template
Presentation Clipart
This image showcases colorful 3D graphs and charts on a light background, ideal for data presentations.
Data Visualization Background
Presentation Clipart
Download this infographic to visually present data, simplifying complex information and highlighting key performance metrics for easier understanding.
Data Visualization Infographic Template
Presentation Clipart
Download this sunshine pictograph to represent sunlight exposure comparisons, using playful sun icons to simplify complex data.
Sunshine Exposure Pictograph Template
Presentation Clipart
Download or customize with your settings this pictograph highlighting global wealth disparity, conveying economic data on rich vs. poor.
World Wealth Distribution Pictograph Template
Presentation Clipart
Download or customize this pictograph for clear, visually appealing statistical data on transportation modes, distinguished by color-coded icons.
School Transportation Pictograph Template
Presentation Clipart
Download this Halloween pictograph to visually represent the popularity of the holiday, using iconic imagery for quick statistical insights.
Halloween Popularity Pictograph Template
Presentation Clipart
Meta Description: Download or customize with your settings this editable pictograph, featuring branches for customizable data and apples symbolizing outcomes.
Tree Infographic Template
Presentation Clipart
An animation of a smart phone with a bar graph rising up and down.
Smart Phone Bar Stats
PowerPoint Animation
An image of a smart phone with a bar graph rising out from surface.
Smart Phone Statistics
Presentation Clipart
This clip art image shows a business figure reinforcing a bell graph bell curve.
Business Figure Holding Up Bell Curve
Presentation Clipart
Download or customize this pictograph highlighting unsolved crime statistics, making complex data on unresolved criminal activity clear and impactful.
Unsolved Crimes Pictograph Template
Presentation Clipart
A widescreen presentation slide from pyramid-toolkit-pid-22279 preview one.
A standard definition presentation slide from Pyramid Toolkit preview two.
A standard definition presentation slide from Pyramid Toolkit preview three.
A standard definition presentation slide from Pyramid Toolkit preview four.
Pyramid Toolkit
Template for PowerPoint
A widescreen presentation slide from pyramid-toolkit-pid-22278 preview one.
A widescreen presentation slide from Pyramid Toolkit preview two.
A widescreen presentation slide from Pyramid Toolkit preview three.
Pyramid Toolkit
Template for PowerPoint
Download this Medical Matrix Pictograph for a clear statistical analysis of health data, with color-coded icons highlighting varying health statuses.
Medical Matrix Pictograph Template
Presentation Clipart
Download or customize this pictograph showcasing educational achievement using graduation caps, effectively communicating statistical data visually.
Fun Fact Pictograph Template
Presentation Clipart
A widescreen presentation slide from bar-levels-toolkit-pid-28976 preview one.
A widescreen presentation slide from Percentage Bar Chart Diagrams PowerPoint Toolkit preview two.
A widescreen presentation slide from Percentage Bar Chart Diagrams PowerPoint Toolkit preview three.
Percentage Bar Chart Diagrams PowerPoint Toolkit
A widescreen presentation slide from venn-diagram-tool-kit-pid-27765 preview one.
A widescreen presentation slide from Venn PowerPoint Diagram Template preview two.
A widescreen presentation slide from Venn PowerPoint Diagram Template preview three.
Venn PowerPoint Diagram Template
A widescreen presentation slide from assorted-graph-slides-pid-14060 preview one.
A standard definition presentation slide from Assorted Graph Slides preview two.
A standard definition presentation slide from Assorted Graph Slides preview three.
A standard definition presentation slide from Assorted Graph Slides preview four.
Assorted Graph Slides
Template for PowerPoint
A widescreen presentation slide from assorted-graph-slides-pid-13992 preview one.
A widescreen presentation slide from Assorted Graph Slides preview two.
A widescreen presentation slide from Assorted Graph Slides preview three.
Assorted Graph Slides
Template for PowerPoint

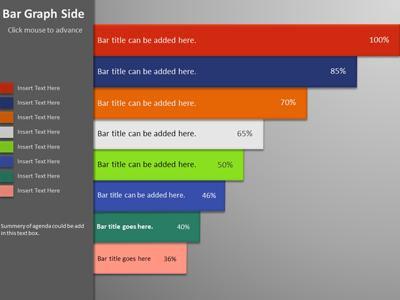
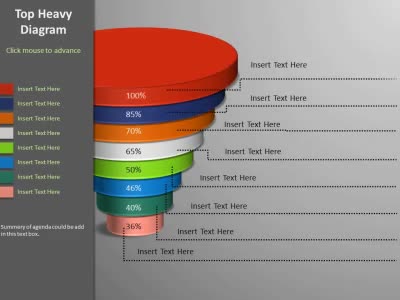
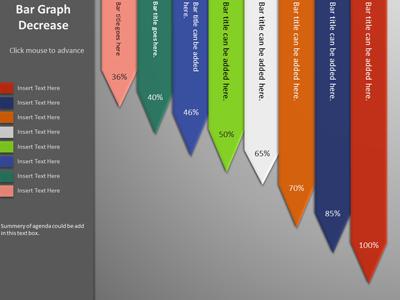
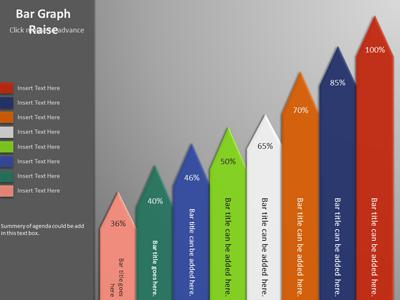
Professionally designed 3D clip art for PowerPoint presentations. All of our images are easily used in any presentation and over any color background. Our images can be downloaded as transparent PNGs. This means they have a clear background and have already been isolated. Simply cut and paste into your presentation or any of our PowerPoint Templates.

Our Clip Art also works great on your web site, blog, Facebook page, mobile applications and more.

Since we are also the artists who make the clipart, we are constantly adding new clip art to PresenterMedia. In fact we add new clip art images nearly every day. We love suggestions from our members, let us know what you'd like to see on PresenterMedia.

Your presentations are going to be amazing! See Plans and Pricing

© 2009-2021 Eclipse Digital Imaging, Inc.

Quality PowerPoint Templates, Animations, videos, and 3D Clipart.
PowerPoint® is a registered trademark of Microsoft Corporation.