Up to 50% OFF
What Can I Customize?
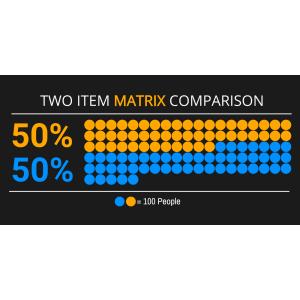
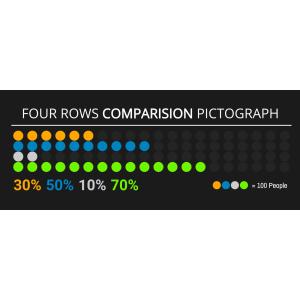
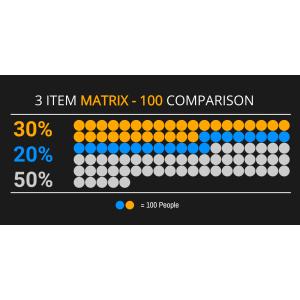
A pictograph is a simple data visualization that uses repeated icons to represent quantities. PresenterMedia pictographs are fully editable graphics you can customize online and download as high-quality images for slides, documents, or the web.
Open the online editor to edit values, labels, and text. Choose your icon style, adjust colors or layout, and when finished, click the Build and Download button to generate your customized image.
Yes. Select an icon set and click Edit. Under the Format Pictograph panel, use the paintbrush tool to adjust icon colors. You can also control how many icons are filled to reflect your values.
Absolutely. Update the quantities, click Update, and the pictograph will instantly adjust to match your changes.
Your customized pictograph downloads as a high-resolution PNG images. Perfect for use in presentations, documents, websites, or print.
Yes. Simply insert the PNG image into any slide like a regular picture. It scales cleanly and displays exactly as designed.
A limited selection is available for free. Full access to all pictographs and advanced customization features is included with a PresenterMedia Unlimited Plan Subscription.
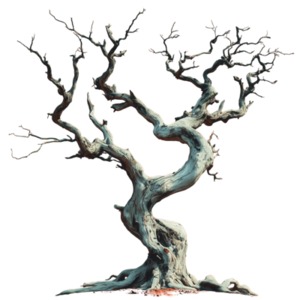
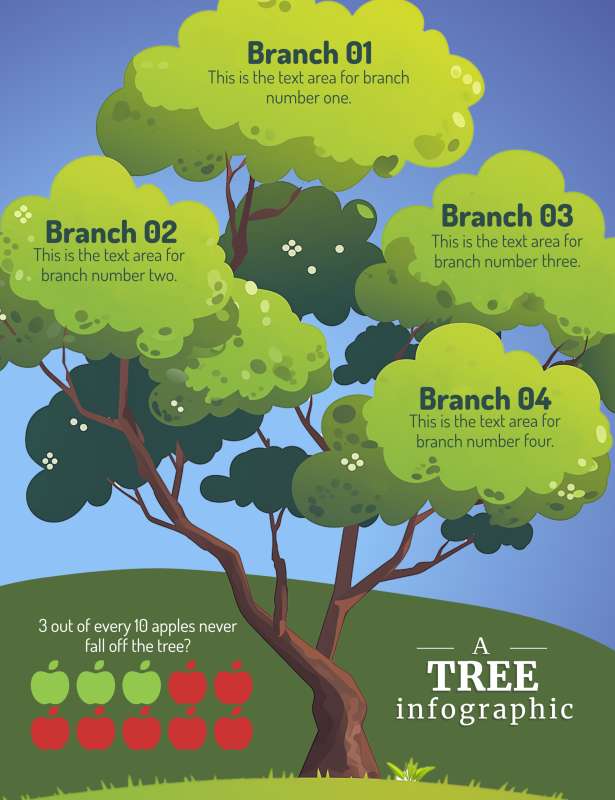
This editable tree infographic features a stylized tree with lush green leaves and four branches, each labeled as Branch 01 to Branch 04 with corresponding text areas for information. Below the tree, there is a fact presented alongside red apple icons, indicating a statistical representation.
This editable pictograph allows users to customize each branch with specific information, making it a versatile tool for various presentations. The apples at the bottom add a visual element to represent data or outcomes.
By clicking the Customize This Item button above, you can change text, add an image, delete elements, or access the pictograph/infographic editor to change the icons, add or decrease icons, and change the layout. This customization feature allows you to tailor the infographic to fit your needs and preferences, making it a highly adaptable tool for various purposes.
This infographic represents growth and branching out of ideas or concepts in an organized manner. Each branch serves as a metaphor for different sections or categories that stem from one central idea, much like how branches grow from the trunk of a tree. The apples at the bottom could symbolize the fruits of labor, or results yielded after developing ideas or projects. It visually emphasizes how various components contribute to the whole picture.
The image can be seen as an educational tool that illustrates how different subjects or lessons are interconnected, stemming from the foundational knowledge represented by the trunk. The branches could represent specific disciplines such as mathematics, science, literature, and arts, each with its own subset of knowledge areas. The apples might signify achievements or goals students aim to reach through their learning journey. This infographic can also show progressions in learning stages or categorize competencies within educational frameworks. Overall, it provides a clear and engaging way to visualize educational concepts and their interrelations.
Adding this clipart image to a slide in one of our PowerPoint templates can create a visual focal point to accompany the presentation slide message. It helps in breaking down complex information into visually appealing segments. This can enhance audience engagement and retention of the presented material.
v be overlaid on different backgrounds without clashing designs. By clicking on the background layer's visibility in the layers tab, designers can easily integrate this pictograph seamlessly into existing layouts. This feature enhances the flexibility and usability of the infographic in diverse design contexts.
You can find many more standout Pictographs for visual aids. These pictographs are designed to make your presentations more engaging and informative. Explore our collection to find the perfect visual aids for your next project.
pictograph infographic tree branches data outcomes apples
Similar Templates and Designs
© 2009-2025 Eclipse Digital Imaging, Inc.
Quality PowerPoint Templates, Animations, videos, and 3D Clipart.
PowerPoint® is a registered trademark
of Microsoft Corporation.