Up to 50% OFF
What Can I Customize?
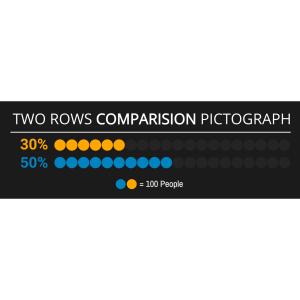
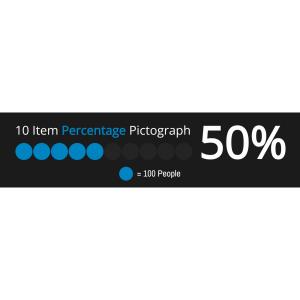
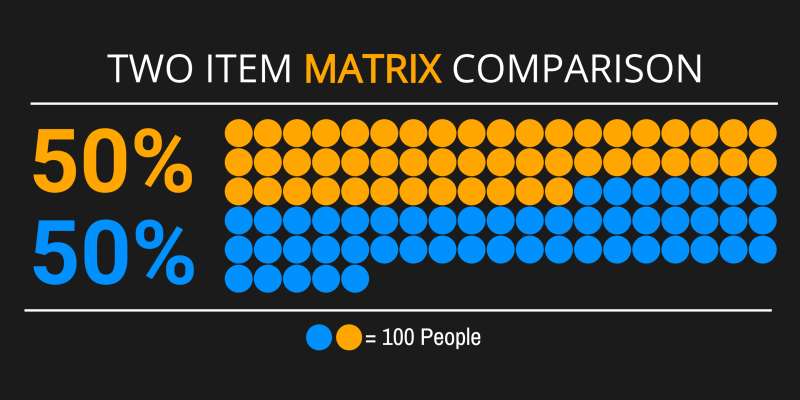
This pictograph template displays a two-item matrix comparison with two horizontal bars composed of circles. Each bar represents 50%, with the top bar in orange and the bottom in blue, each containing an equal number of circles to represent this percentage visually.
If you click on 'Customize This Item', you'll find that you can personalize this graphic extensively. You can change text, add images, delete elements you don't need or access advanced features like editing icons directly within the pictograph editor—allowing you to adjust icon sizes or alter layout configurations according to your specific requirements.
This pictograph could symbolize a balanced comparison between two different datasets or groups. It visually represents equality or a 50/50 distribution, which can help illustrate split decisions, evenly divided opinions, or any scenario with an equal share between two entities.
This image's transparent PNG background makes it highly versatile for media design projects. The ability to remove the background by clicking the background layer's visibility in the layers tab enhances its adaptability for various design needs. This feature allows designers to overlay this pictograph onto different backgrounds seamlessly, making it ideal for integration into diverse visual contexts without clashing elements.
Add this clipart image to a slide in one of our PowerPoint templates to create a visual focal point that complements your presentation message. This can help draw attention to key data points and make your slides more engaging. The clear and balanced design of this pictograph ensures that it enhances rather than distracts from your content.
You can find many more standout Pictographs for visual aids on our website. These graphics are designed to help you convey complex information in a simple and visually appealing way. Explore our collection to find the perfect pictograph for your next project.
pictograph two category matrix data distribution comparison datasets percentage graph chart statistics
Similar Templates and Designs
© 2009-2021 Eclipse Digital Imaging, Inc.
Quality PowerPoint Templates, Animations, videos, and 3D Clipart.
PowerPoint® is a registered trademark
of Microsoft Corporation.