Up to 50% OFF
What Can I Customize?
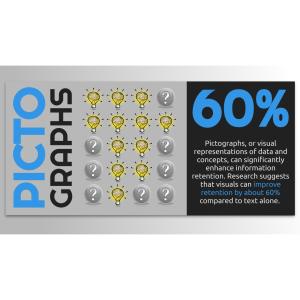
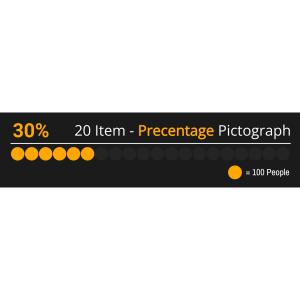
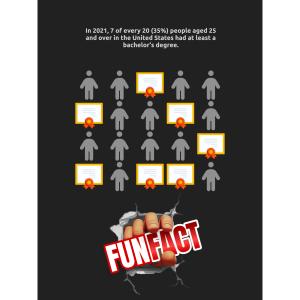
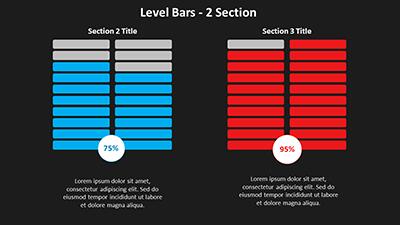
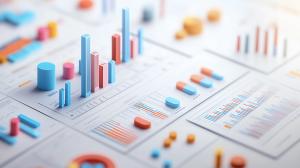
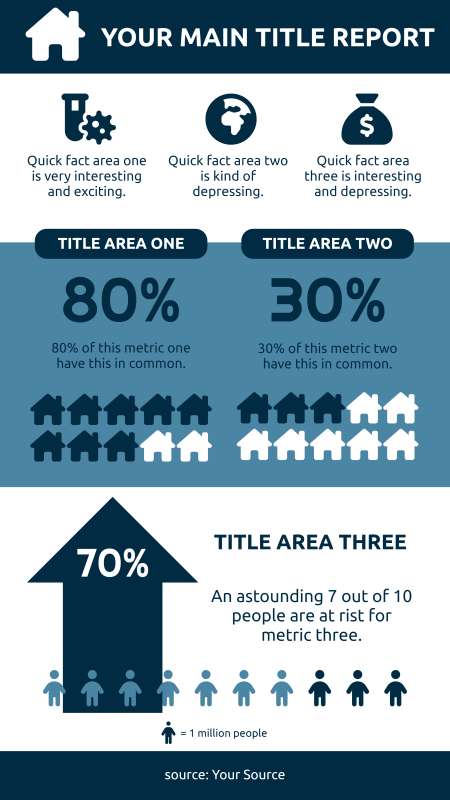
This editable pictograph displays icons and percentages in a clean, organized format. The graphic includes three title areas, each with different icons such as a lightbulb, gears, and dollar sign, accompanied by statistics in large font and additional descriptive text.
To personalize this infographic, click Customize This Item above. You can change text, add images, delete elements, or access more customization options like changing icons or layout within the pictograph editor itself. These features allow you to tailor the content specifically for your audience's needs while maintaining a professional and polished look.
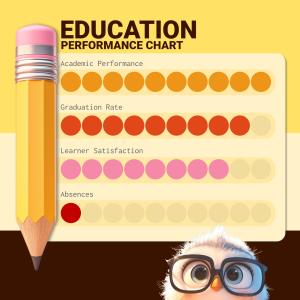
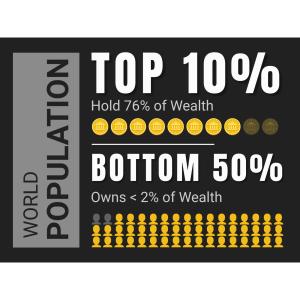
The concept of an infographic is to present data visually to make complex information more accessible. This infographic could represent various metrics or key performance indicators important for understanding a specific topic or area of interest.
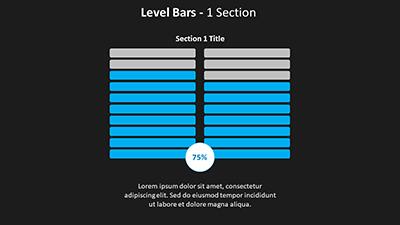
In the context of business and marketing, this image represents a tool for conveying strategic information succinctly. The use of icons like gears and dollar signs can symbolize processes and financial goals respectively. The percentages provide quick insights into performance metrics such as market share or revenue growth. This type of visual aid is crucial for stakeholders to quickly grasp the health or progress of different business segments. It also serves as an engaging method to present data during meetings or reports without overwhelming the audience with numbers.
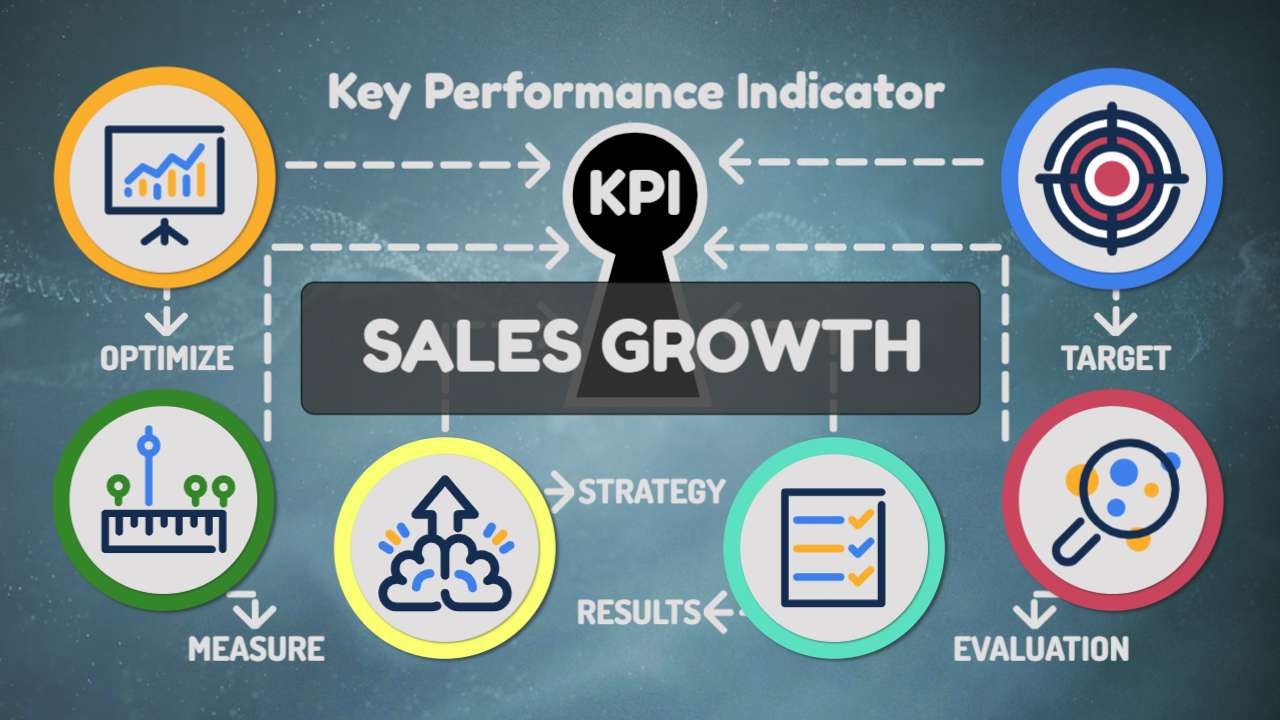
Adding this clipart image to a slide in one of our PowerPoint templates can create a visual focal point to accompany the presentation slide message. It helps in breaking down complex information into digestible visuals. This enhances audience engagement and retention of the presented data.
The transparent PNG background makes this image versatile for various media design projects, allowing it to be overlaid on different backgrounds seamlessly. By clicking the background layer's visibility in the layers tab, designers can easily integrate this pictograph into larger compositions without any background clash. This feature enhances its adaptability across multiple platforms and design scenarios.
You can find many more standout Pictographs for visual aids. These pictographs are designed to enhance your presentations and reports. They provide a visually appealing way to convey important information.
infographic pictograph data visualization metrics key performance indicators accessible information
Similar Templates and Designs
© 2009-2021 Eclipse Digital Imaging, Inc.
Quality PowerPoint Templates, Animations, videos, and 3D Clipart.
PowerPoint® is a registered trademark
of Microsoft Corporation.