Up to 50% OFF

What Can I Customize?
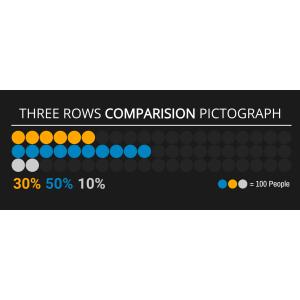
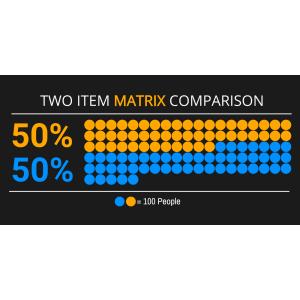
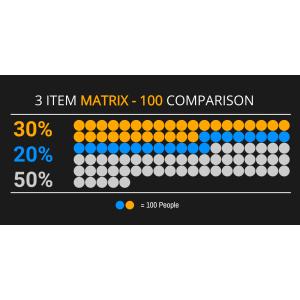
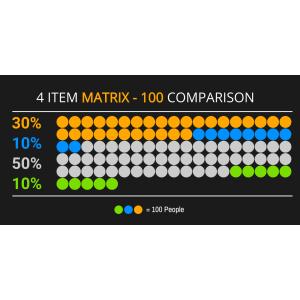
A pictograph is a simple data visualization that uses repeated icons to represent quantities. PresenterMedia pictographs are fully editable graphics you can customize online and download as high-quality images for slides, documents, or the web.
Open the online editor to edit values, labels, and text. Choose your icon style, adjust colors or layout, and when finished, click the Build and Download button to generate your customized image.
Yes. Select an icon set and click Edit. Under the Format Pictograph panel, use the paintbrush tool to adjust icon colors. You can also control how many icons are filled to reflect your values.
Absolutely. Update the quantities, click Update, and the pictograph will instantly adjust to match your changes.
Your customized pictograph downloads as a high-resolution PNG images. Perfect for use in presentations, documents, websites, or print.
Yes. Simply insert the PNG image into any slide like a regular picture. It scales cleanly and displays exactly as designed.
A limited selection is available for free. Full access to all pictographs and advanced customization features is included with a PresenterMedia Unlimited Plan Subscription.
This editable pictograph displays a series of human figures with graduation caps, where one out of every seven figures is highlighted in color to stand out from the others. Below these figures, the title "Fun Fact" is prominently displayed in a bold and playful font, breaking through what appears to be a wall.
The pictograph represents statistical data in a visual format, making complex information more accessible and engaging. The use of human figures with graduation caps symbolizes educational achievement. The ratio depicted suggests a comparison or trend within a specific demographic. This visualization technique effectively communicates quantitative data through qualitative imagery.
You have numerous options by clicking on 'Customize This Item' above. You can change the text, add an image, delete elements, or access the pictograph editor to change the icons, increase or decrease the number of icons, and adjust the layout. This flexibility allows you to tailor the pictograph to fit your needs and preferences.
In business and education contexts, this image is an illustrative tool to convey the proportion of individuals with higher education degrees. It highlights the significance of academic achievement within the workforce and can emphasize the value of investing in education. The pictograph reflects societal trends and can inform policy-making or strategic planning in educational institutions and companies seeking educated talent. Furthermore, it underscores the competitive edge that higher education provides in professional settings.
Adding this clipart image to a slide in one of our PowerPoint templates can create a visual focal point to accompany the presentation slide message. It helps to break up text-heavy slides and keeps the audience engaged. The visual representation of data can make your points more memorable and impactful.
This image's transparent PNG background makes it versatile for various media design projects. It allows for seamless integration into different backgrounds without awkward borders or mismatches. Designers can easily remove the background by clicking the background layer's visibility in the layers tab, providing flexibility for creative adaptations across multiple platforms.
You can find many more standout Pictographs for visual aids. These graphics are designed to enhance your presentations and reports. They provide a visually appealing way to present data and concepts.
pictograph educational achievement statistics graduation comparison demographic
Similar Templates and Designs
© 2009-2025 Eclipse Digital Imaging, Inc.
Quality PowerPoint Templates, Animations, videos, and 3D Clipart.
PowerPoint® is a registered trademark
of Microsoft Corporation.