Up to 50% OFF
What Can I Customize?
A pictograph is a simple data visualization that uses repeated icons to represent quantities. PresenterMedia pictographs are fully editable graphics you can customize online and download as high-quality images for slides, documents, or the web.
Open the online editor to edit values, labels, and text. Choose your icon style, adjust colors or layout, and when finished, click the Build and Download button to generate your customized image.
Yes. Select an icon set and click Edit. Under the Format Pictograph panel, use the paintbrush tool to adjust icon colors. You can also control how many icons are filled to reflect your values.
Absolutely. Update the quantities, click Update, and the pictograph will instantly adjust to match your changes.
Your customized pictograph downloads as a high-resolution PNG images. Perfect for use in presentations, documents, websites, or print.
Yes. Simply insert the PNG image into any slide like a regular picture. It scales cleanly and displays exactly as designed.
A limited selection is available for free. Full access to all pictographs and advanced customization features is included with a PresenterMedia Unlimited Plan Subscription.
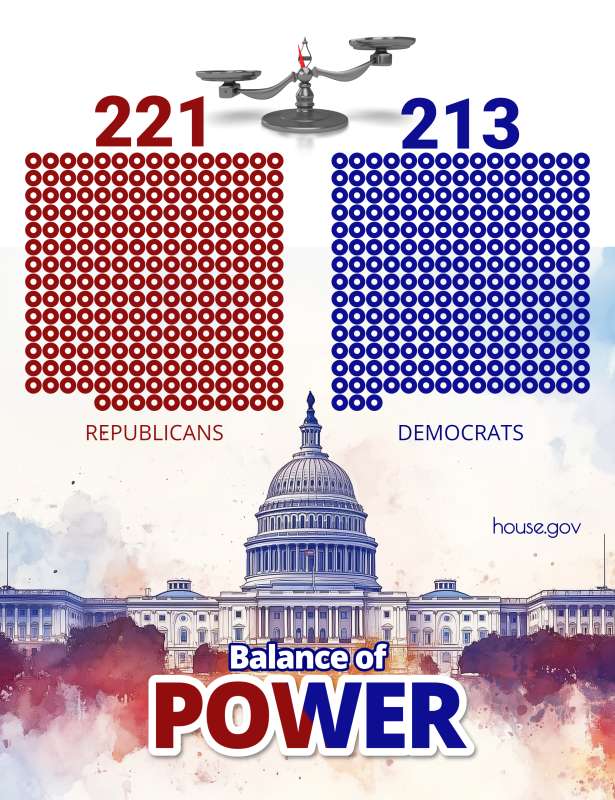
The image displays a pictograph titled "Balance of Power Pictograph" with two large groups of icons on either side of a scale. On the left, there are 221 red icons representing Republicans. On the right are 213 blue icons representing Democrats, with an illustration of the Capitol building below and 'house.gov' written at the bottom.
By clicking the ‘Customize This Item’ button above, you can change text, add an image, delete elements, or access the pictograph editor to change the icons, add increase/decrease icons, and change the layout. This feature provides a user-friendly interface for adjusting your specific needs. Whether you need to update the data, change the visual style, or add new elements, the customization options are extensive and easy to use.
This pictograph represents the concept of balance of power, which is fundamental in democratic systems to prevent any one group from having too much control. The even distribution on either side of the scale symbolizes a system where power is shared and checked between different parties or entities. It suggests that for effective governance, there must be a counterbalance to each action and decision made within a political framework. The visual metaphor emphasizes equilibrium as essential for fairness and stability in governance.
In the context of government and elections, this image symbolizes the distribution of seats between two major political parties within a legislative body. The red and blue icons indicate that although one party may have more representatives than the other, there is still a significant presence from both sides to influence legislation. This reflects how elections determine which party holds more sway in creating laws but also shows that minority voices remain integral to the legislative process. The balance scale at the top underscores that despite differences in numbers, both parties play crucial roles in maintaining democratic balance through their elected officials. This visual representation helps to convey the importance of a balanced and fair legislative process where diverse perspectives are considered and respected.
Adding this clipart image to a slide in one of our PowerPoint templates can create a visual focal point to accompany the presentation slide message. It helps to break down complex information into a more digestible visual format. This can enhance audience engagement and understanding during your presentation.
This image with a transparent PNG background is handy in media design projects. It allows seamless integration into various design layouts without worrying about background clashes. The transparency ensures that the pictograph can be layered over different backgrounds, making it versatile for presentations, websites, and printed materials. This adaptability enhances the visual appeal and effectiveness of the design project.
You can find many more standout Pictographs for visual aids. These pictographs are designed to help you convey information clearly and effectively. Explore our collection to find the perfect visual aid for your next project.
pictograph government political balance power distribution seats scale USA America election
Similar Templates and Designs
© 2009-2025 Eclipse Digital Imaging, Inc.
Quality PowerPoint Templates, Animations, videos, and 3D Clipart.
PowerPoint® is a registered trademark
of Microsoft Corporation.