Up to 50% OFF
Variations
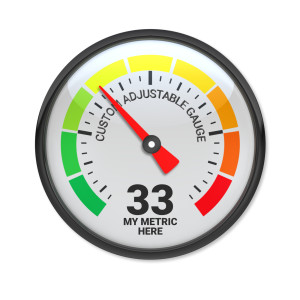
The animation depicts a gauge with a needle that swiftly moves into the green zone, indicating full power or high energy levels. The gauge is segmented into three colored zones: red, yellow, and green. The needle's movement suggests a positive outcome as it settles in the green area.
This animated optimal level gauge symbolizes achievement and reaching a goal, as the needle landing in the green suggests optimal performance or status. It represents success, completion, or favorable conditions within a system. The movement of the needle from lower to higher zones can also imply progress or improvement over time.
This image can represent experimental results reaching desired thresholds or safety levels in science. In education, it could symbolize students achieving learning objectives or mastering skills. This gauge could illustrate sales targets being met or exceeded within business contexts. It also serves as an indicator of efficiency for processes and systems across various industries. Furthermore, it can communicate energy levels in sustainability and resource management discussions.
You can add this animation clip to a slide in one of our PowerPoint templates to create an eye-catching visual focal point that would enhance your message. The movement of the gauge's needle can draw attention to critical data or trends being discussed. This dynamic element can help emphasize key points and make your presentation more engaging.
An animated GIF like this is highly versatile for media design projects due to its dynamic nature, which captures attention more effectively than static images. It can be easily embedded into web pages or digital documents to add motion and interest. Additionally, its looped animation offers continuous engagement without requiring user interaction.
You can find many more engaging PowerPoint animations for visual aids that enhance your presentations. These animations can help convey complex information in an easily understandable and visually appealing way.
gauge performance achievement goal success progress completion optimal status improvement system efficiency
Similar Templates and Designs
© 2009-2021 Eclipse Digital Imaging, Inc.
Quality PowerPoint Templates, Animations, videos, and 3D Clipart.
PowerPoint® is a registered trademark
of Microsoft Corporation.