Up to 50% OFF

Variations
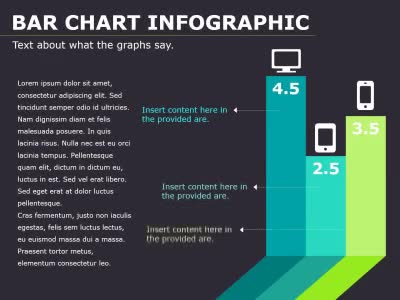
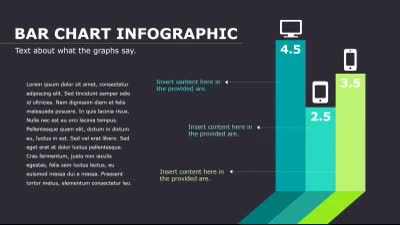
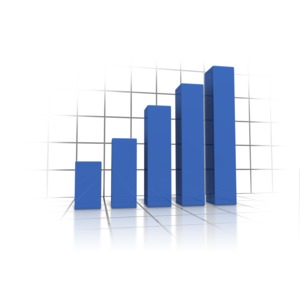
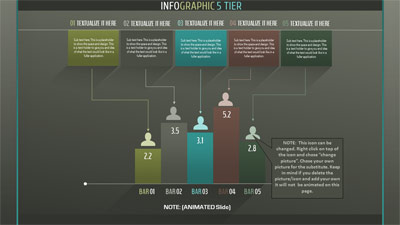
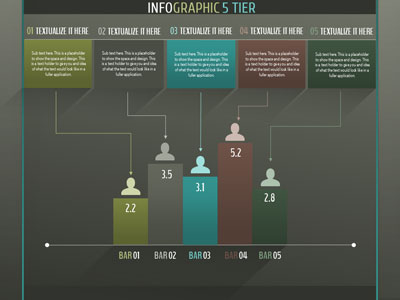
This image features a stylized bar chart clipart for business presentations with four vertical bars of varying heights, each represented in different shades of blue and green. The bars are set on a light-colored base, giving a modern and clean appearance, which enhances the visual impact of the data representation.
This bar chart illustration for PowerPoint and Google Slides could represent various data points, such as sales figures, performance metrics, or growth statistics over time. The ascending heights of the bars suggest an increase in values, making it suitable for presentations related to business growth or statistical analysis. The use of cool colors may convey a sense of professionalism and clarity, making it ideal for corporate or educational settings. Overall, this visual data clipart for reports and analytics serves as an effective tool for conveying quantitative information in a straightforward manner.
Adding a stylized bar chart clipart with four vertical bars of varying heights to PowerPoint or Google Slides is simple and impactful. First, download the clipart from a trusted source. In PowerPoint, go to Insert > Pictures and upload the image from your device. In Google Slides, click Insert > Image > Upload from computer or drag and drop it directly onto your slide. Once inserted, you can easily resize, move, or layer the clipart to match your layout and highlight key data points.
This bar chart clipart can also be seamlessly integrated into our PowerPoint templates to instantly create a cohesive and professional theme. Simply add the clipart to a pre-designed slide layout that suits business, marketing, or educational content. The modern, clean style of the bars fits naturally with our polished templates, helping you emphasize your data clearly and beautifully. Whether you're showcasing sales figures, performance growth, or statistical trends, this bar chart makes your message visually compelling and easy to grasp. Elevate your presentations by combining trusted designs with this powerful visual element.
To find more images like this, explore our Presentation Clipart library. You can also incorporate this image into any of our PowerPoint Templates for a polished presentation.
bar chart, data visualization, statistics, business growth, icon
Similar Templates and Designs
© 2009-2021 Eclipse Digital Imaging, Inc.
Quality PowerPoint Templates, Animations, videos, and 3D Clipart.
PowerPoint® is a registered trademark
of Microsoft Corporation.