Up to 50% OFF
What Can I Customize?
A pictograph is a simple data visualization that uses repeated icons to represent quantities. PresenterMedia pictographs are fully editable graphics you can customize online and download as high-quality images for slides, documents, or the web.
Open the online editor to edit values, labels, and text. Choose your icon style, adjust colors or layout, and when finished, click the Build and Download button to generate your customized image.
Yes. Select an icon set and click Edit. Under the Format Pictograph panel, use the paintbrush tool to adjust icon colors. You can also control how many icons are filled to reflect your values.
Absolutely. Update the quantities, click Update, and the pictograph will instantly adjust to match your changes.
Your customized pictograph downloads as a high-resolution PNG images. Perfect for use in presentations, documents, websites, or print.
Yes. Simply insert the PNG image into any slide like a regular picture. It scales cleanly and displays exactly as designed.
A limited selection is available for free. Full access to all pictographs and advanced customization features is included with a PresenterMedia Unlimited Plan Subscription.
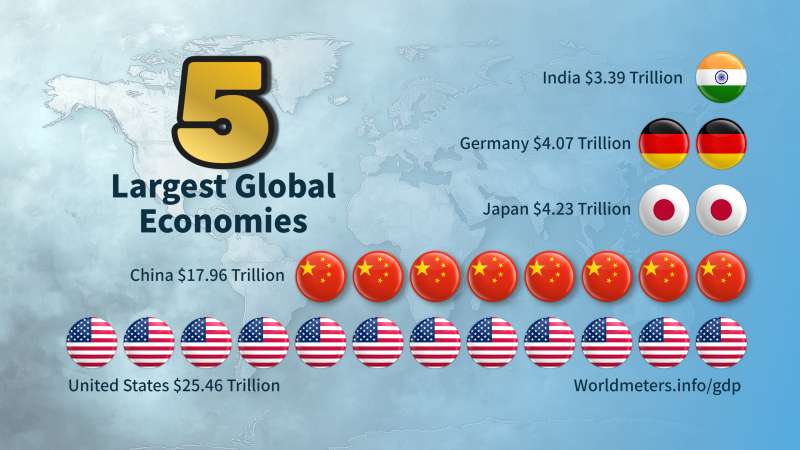
This editable pictograph displays the five largest global economies, represented by a map of the United States in the background and rows of icons for each country. Each row features a country's flag, a numerical ranking, and corresponding economic output in trillions, alongside circular icons indicating relative size.
The 'Global Economies' concept here suggests a comparative analysis of national economic power. It visually quantifies and ranks countries based on their Gross Domestic Product (GDP), providing an immediate sense of scale and international financial standings.
To tailor this graphic to specific needs or branding styles, click the Customize This Item button above. You can change text, add an image, delete elements, or access the pictograph editor to change the icons, increase/decrease icons, and change the layout.
This image represents financial strength and global influence by depicting economic size. The United States has the highest GDP at $25.36 trillion, followed by China, Japan, Germany, and India. The use of flags personalizes each economy to its nation, while the quantity of icons per row visually amplifies the message about each country's economic weight. This pictograph is a stark reminder that economic power is not evenly distributed across nations. It also subtly hints at potential political power dynamics influenced by these financial standings.
Adding this clipart image to a slide in one of our PowerPoint templates can create a visual focal point to accompany the presentation slide message. It helps to break down complex data into easily digestible visuals. This can enhance audience engagement and retention of information.
The transparent PNG background makes this image versatile for various media design projects where blending with different backgrounds is needed. By clicking the background layer's visibility in the layers tab, designers can seamlessly integrate this graphic into broader compositions without conflicting backgrounds. This feature enhances its utility across diverse design applications, from web graphics to printed materials.
You can find many more standout Pictographs for visual aids. These can be used to illustrate various data points and concepts effectively. They are designed to make your presentations more impactful and visually appealing.
global economies GDP comparison ranking economic power financial
Similar Templates and Designs
© 2009-2025 Eclipse Digital Imaging, Inc.
Quality PowerPoint Templates, Animations, videos, and 3D Clipart.
PowerPoint® is a registered trademark
of Microsoft Corporation.