Up to 50% OFF
Variations
When you select a layout, the Presentation Builder The Presentation Builder lets you generate or edit AI text, add slides, adjust theme colors, and download your PowerPoint file (works in Google Slides). opens so you can customize the slide and download your PowerPoint file. Watch tutorial
Download the animated GIF from PresenterMedia. In PowerPoint, go to Insert → Pictures → This Device, and select your file. Resize and position it on your slide — it will animate automatically during the slideshow.
Yes. Upload the GIF to your Google Drive. In Google Slides, choose Insert → Image → Drive, then select your animation. It will animate automatically during presentation mode.
Yes. Our animations are available as GIF files, which are widely supported across many platforms. You can insert them into any software that supports animated GIFs, including Microsoft Word, Keynote, Canva, email builders, websites, and most social media platforms. Just download the animation as a GIF and insert it like any standard image.
Use PresenterMedia's animation customizer to change the REPEATS setting to 1 before downloading. This will make the GIF play only once during your presentation.
Animated GIFs are supported in most modern versions of PowerPoint, including PowerPoint 2016 and later. For best results, use in slideshow mode on desktop.
This PowerPoint animation may be included in our free PowerPoint animations section. We offer a limited selection of animations for free so you can try them and see if they fit your design workflow. Visit the PowerPoint animations page and find free animations marked with a green arrow in the top-right corner of each preview thumbnail.
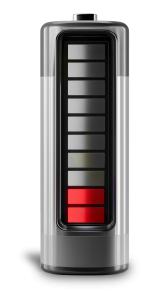
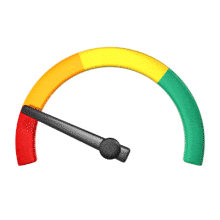
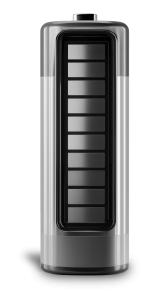
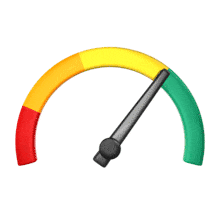
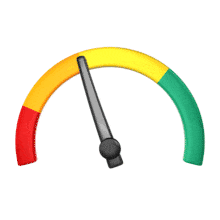
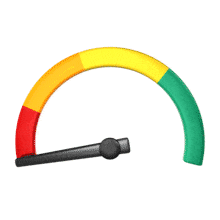
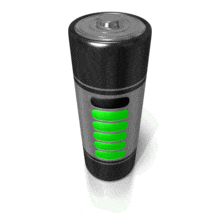
The animation depicts a gauge with a needle that starts fully in the green zone, indicating full power or capacity. As the animation progresses, the needle moves steadily toward the red zone, signifying a decrease to an empty or critical state.
This visual representation effectively shows the transition from abundance to scarcity. The needle's movement from green to red is a clear indicator of diminishing levels.

This gauge animation can symbolize various concepts, such as resource depletion, loss of energy, or a warning signal for low levels. It visually represents a transition from a state of abundance or safety to one of scarcity or danger. The movement from green to red is commonly understood as moving from good to bad conditions, making this imagery universally recognizable. This makes it a powerful tool for conveying messages about decline or urgency in various contexts.
In science, this image could represent data trends such as battery discharge or fuel consumption over time. It can illustrate how resources are used up and the importance of monitoring levels to prevent critical shortages. In education, it serves as an illustrative tool for teaching about measurement, scales, and thresholds. Students can better understand abstract concepts through visual aids that show real-time changes.
Within business contexts, it could symbolize the financial health of an enterprise moving from profitable (green) to debt-ridden (red). This gauge could also be used metaphorically to discuss team morale or project progress. For instance, it can show how a project's resources are depleted and the urgency to take corrective actions.
Add this animated gauge to our PowerPoint templates to create an engaging visual focal point. This animation can help emphasize the message of the slide by visually representing the concept of depletion or urgency. It can make your presentation more dynamic and help the audience understand the key points better.
An animated gif like this animated guage is handy in media design projects due to its dynamic nature which can draw attention more effectively than static images. It can be easily embedded into various digital platforms and provides visual continuity when explaining processes that involve change over time. Additionally, its looped format makes it ideal for conveying ongoing cycles such as monitoring systems continuously checking levels.
You can find many more engaging PowerPoint animations for visual aids. These animations can enhance your presentations by providing dynamic and visually appealing elements. They can help convey complex ideas more effectively and keep your audience engaged throughout the presentation.
gauge depletion decrease urgency decline power diminish level
Similar Templates and Designs
© 2009-2025 Eclipse Digital Imaging, Inc.
Quality PowerPoint Templates, Animations, videos, and 3D Clipart.
PowerPoint® is a registered trademark
of Microsoft Corporation.