Up to 50% OFF
Sign up today and get instant
access to download our PowerPoint templates.
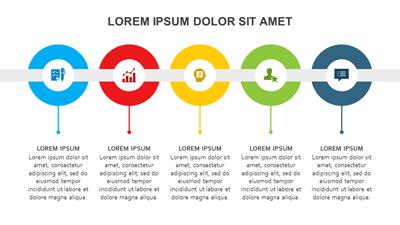
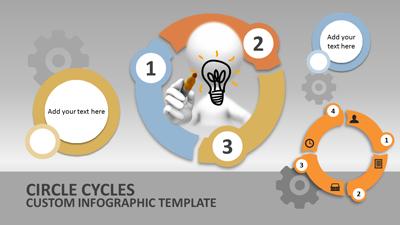
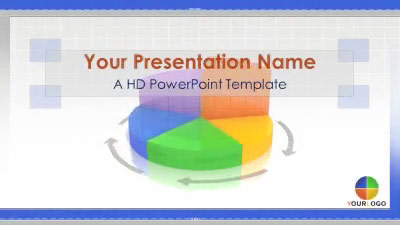
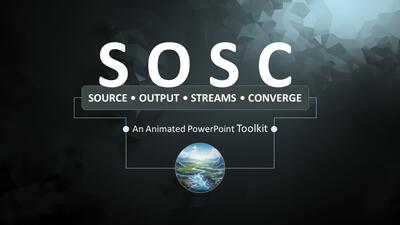
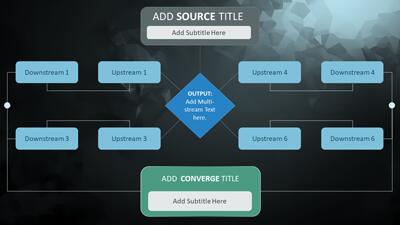
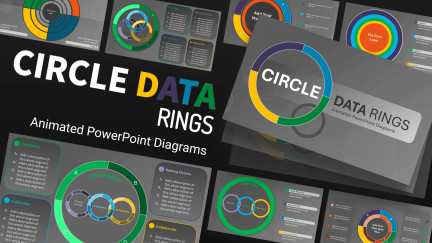
This Circle Data Rings Diagrams Animated PowerPoint Template is a versatile tool that can be used to create informative and visually appealing presentations. The template includes a variety of pre-designed slides that feature circle charts with overlapping rings. These rings can be used to represent a variety of data points, making them ideal for a wide range of presentations.
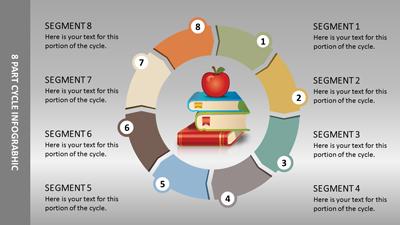
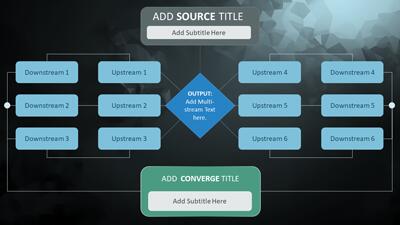
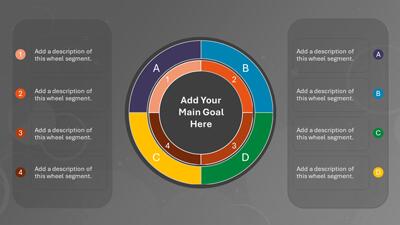
This template features a variety of customizable slides. Each slide features a central circle that is divided into several rings. The size and color of each ring can be easily modified to reflect the data you want to represent. The template also includes space for text labels and icons, which can be used to provide additional information about the data.
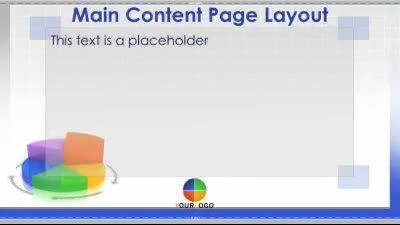
In addition to the pre-designed slides, the template also includes a variety of formatting options. These options allow you to customize the look and feel of your presentation to match your specific needs. For example, you can change the color scheme, font style, and background image of your slides.
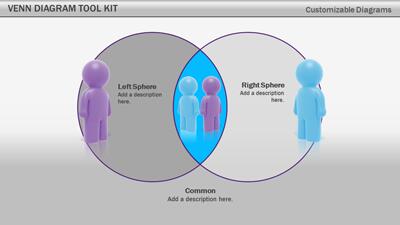
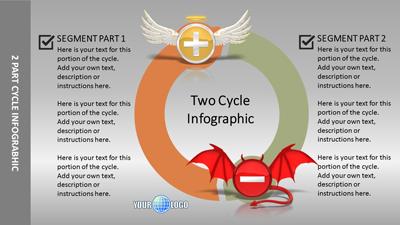
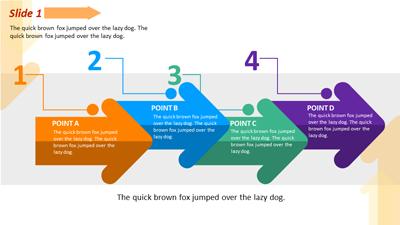
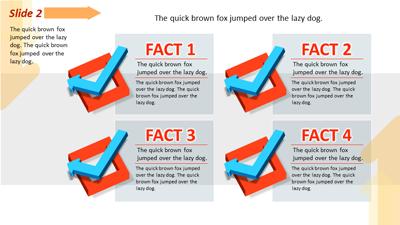
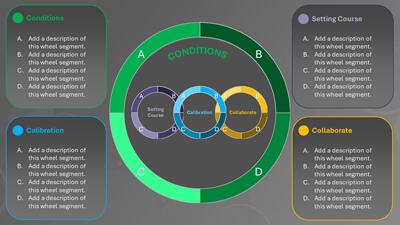
Circle charts with overlapping rings, also known as circular diagrams or nested circle diagrams, can be used to represent a variety of data sets. Here are a few examples:
The Circle Data Rings Diagrams template can be used for a variety of presentations. Here are a few ideas:
Adding slides from this template to your existing presentation is simple. You can copy and paste the slides you want to use into your presentation. Once you have added the slides, you can customize them to match the look and feel of your presentation. You can find more templates like this one by browsing through our selection of PowerPoint templates. Find many template like this in our collection of PowerPoint diagram templates
diagrams circle data rings chart overlapping venn ring process stages market share survey results
Similar Templates and Designs